Input and settings view
This topic describes the purpose of the ESPA analysis center screen's Input and settings view and all the settings and buttons on it.
This feature requires your account to be configured with the ESPA analysis center screen.
The Input and settings view, by default is located in the center of the screen. It can also be minimized on the map or pinned to the Legend/Filter view.
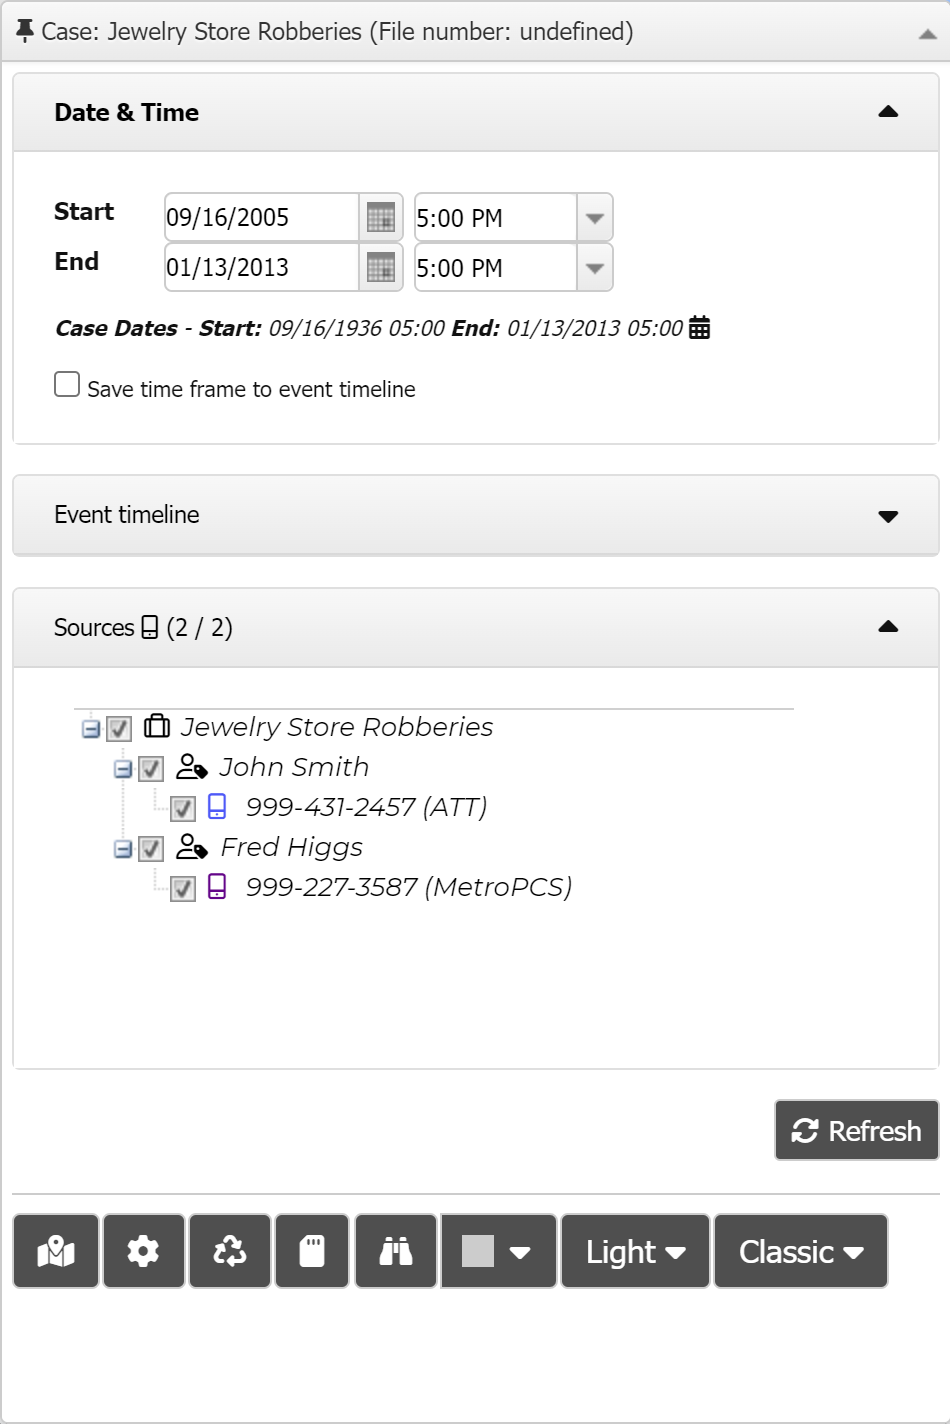

Click to pin the Date & Time, Event timeline and Sources to the Legend/Filter view.

Click to minimize the Input and settings view on the map. When it is minimized an icon is displayed on the top-left of the map. The icon is either red or green depending on whether or not you have loaded the case data on the screen by clicking Refresh.

This allows you to select the time period of interest. Using this information it searches the data you uploaded to the case for phone numbers that were used during this time period and displays them in Sources. Alternatively, if you are only interested in viewing the data during events you can use Event timeline.
This setting is mandatory. This setting is automatically completed with the date and time of the earliest data from all the CDRs and geo-location files that you uploaded for the case. If you want to change the start date and time you can use the date and time pickers to enter the details, or you can enter them manually. If you enter them manually note that the date format used is month/day/year. This date along with the End date are used to retrieve phone numbers used during the specified time interval from the CDRs that you have uploaded.
This setting is mandatory. This setting is automatically populated with the date and time of the latest data from all the CDRs and geo-location files that you uploaded for the case. If you want to change the end date and time you can use the date and time pickers to enter the details, or you can enter them manually. If you enter them manually note that the date format used is month/day/year. This date along with the Start date are used to retrieve phone numbers used during the specified time interval from the CDRs that you have uploaded.
Select then click Refresh to save the current date/time range as an event on the Event timeline screen. The maximum time range you can set is 48 hours.
This provides an alternative to using Date & Time and instead allows you to select the event timelines of interest. Using this information it searches the data you uploaded to the case for phone numbers that were used during this time period and displays them in Sources. Once you select the required sources and click Refresh then only the data during the event timelines you selected is displayed.
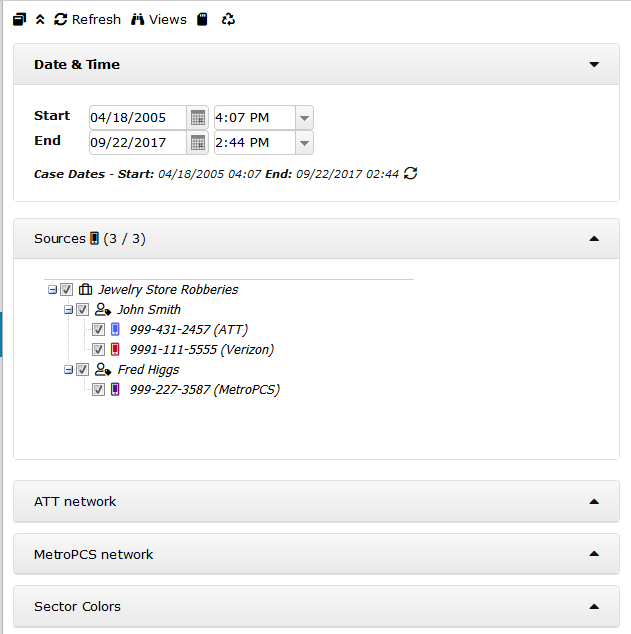
This allows you to select the sources you are interested in. It displays phone numbers from the CDR data and vehicle license plate numbers if the case has geo-location files which you either manually uploaded to a license plate or that were automatically uploaded by live location monitoring to a license plate.
NOTE: This information is automatically completed from the case information.
Select which of the phone numbers you want to use in the analysis. The analysis locates the cell towers used by the selected phone numbers in addition to investigating and displaying other call properties such as the time of the call, the type of call and the phone number the call was with. By default all the phone numbers are selected. The selected phone numbers are used to select the call records and to find any sectors which were involved for the selected calls during the specified date range.
If your case has geo-location files associated with a license plate then select the license plate to include the geo-location files in the geo-location analysis and the Geo-loc data tab.
Click the phone icon alongside the source number to select a different color.
Select a color only if you want to change the color used to represent the currently selected phone from that of the default color for the selected operator. This changes the color of the sectors and event markers used to represent this phone on the ESPA analysis center screen and the Smart track triggered alerts screen. This setting is useful if you have multiple phones from the same operator and you want to display each with a different color.
This setting is coupled with the Display color setting on the People and devices screen.
Click the source number to select which data sources you want to use during your analysis and they also allow you to specify time adjustments for the respective phone or license plate number. If not all data sources are selected or if a timezone adjustment has been set an icon is displayed alongside the source number.
-
 indicates that you do not have all data sources selected.
 -
 indicates that you have timezone adjustments applied.
For further information refer to Phone properties dialog box.
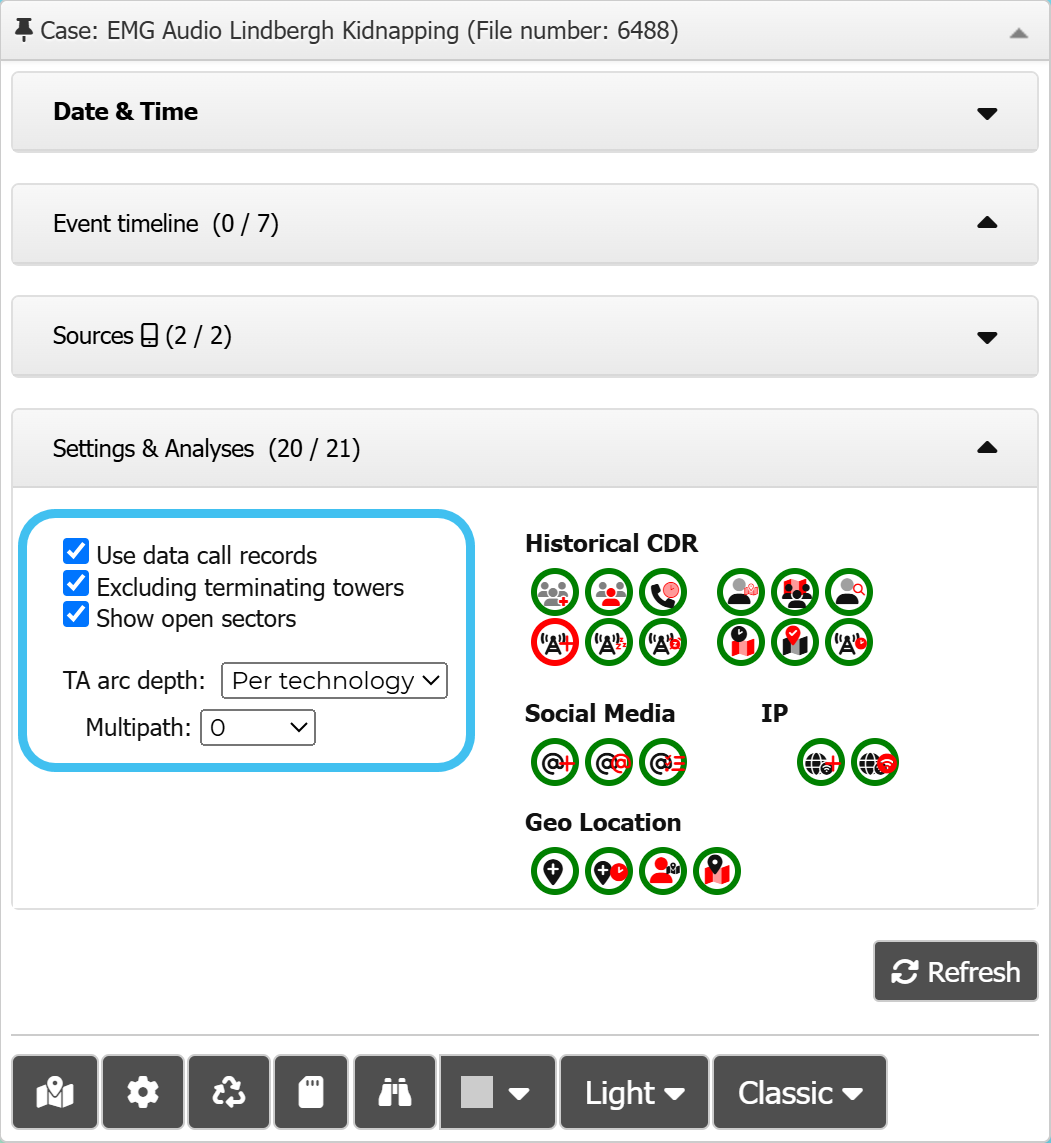
This group allows you to do two things:
-
The settings on the left-side allow you to quickly select some of the most commonly changed settings that are otherwise set on the Advanced options dialog box. These settings are coupled with those on the Advanced options dialog box.
-
The analyses on the right-side allow you to select which call and geo-loc analyses you want to run without opening the Advanced options dialog box. These settings override your default settings on the Advanced options dialog box. A red border around an analysis indicates that it is not selected to run; a green border indicates it is selected. Prior to refreshing the data you should ensure you have the correct analyses selected. If required, once your data is loaded you can also click an analysis to run it individually. These settings are coupled with the
 and
and  settings on the Call analysis and Geo-loc analyses tabs.
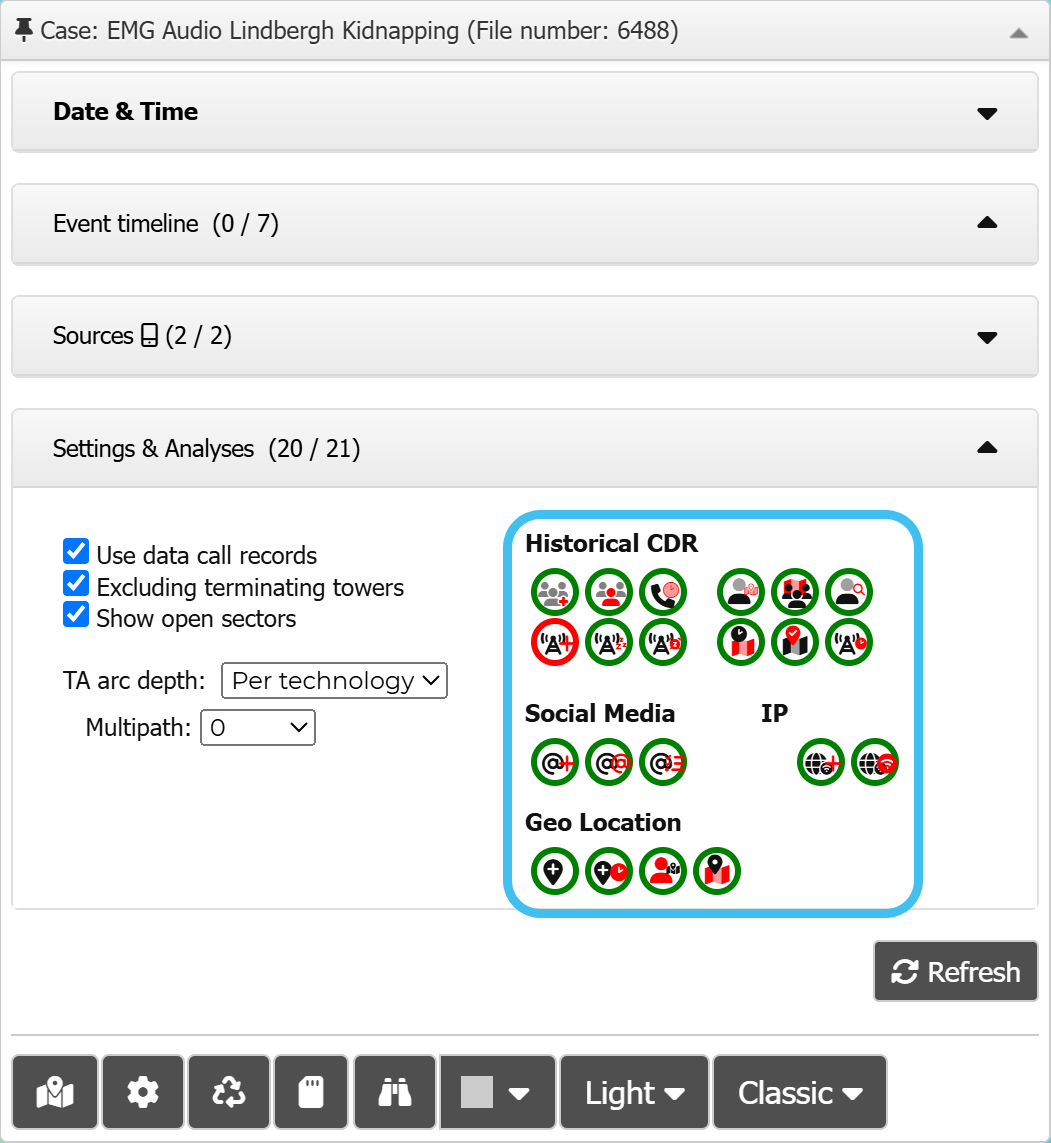
Select if you want to include data calls, including some Timing Advance records, in your analysis. By default this is selected as T-Mobile timing advance records often classify some of their calls as data and if this was not selected then the CDR data tab would not include these useful calls. However, typically an analysis for most CDR file types is done using only voice and SMS calls and not data calls. This is because data calls may not provide accurate location information. If you select to include data calls they are displayed on the CDR data tab using an orange row.
NOTE: If you change this setting the data is refreshed automatically.
Select if you want to exclude terminating cells from automatically being selected on the map and Sector data tab when a call is selected where the originating and terminating towers are different. Also, when this is selected, the Usage column on the Sector data tab does not include the terminating calls in its count.
This setting is selected by default as it is more common to only view the originating sectors and it is easier to see these when the terminating sectors are automatically excluded.
NOTE: If you change this setting the data is refreshed automatically.
Select if you want to display the sectors as open sectors where they are only 20% partially filled. You may want to do this so that you are not showing an exact theoretical cell boundary in your report. Showing an exact theoretical cell boundary could cause people to incorrectly believe that the cell coverage ends exactly where the displayed theoretical pie cell boundary ends.
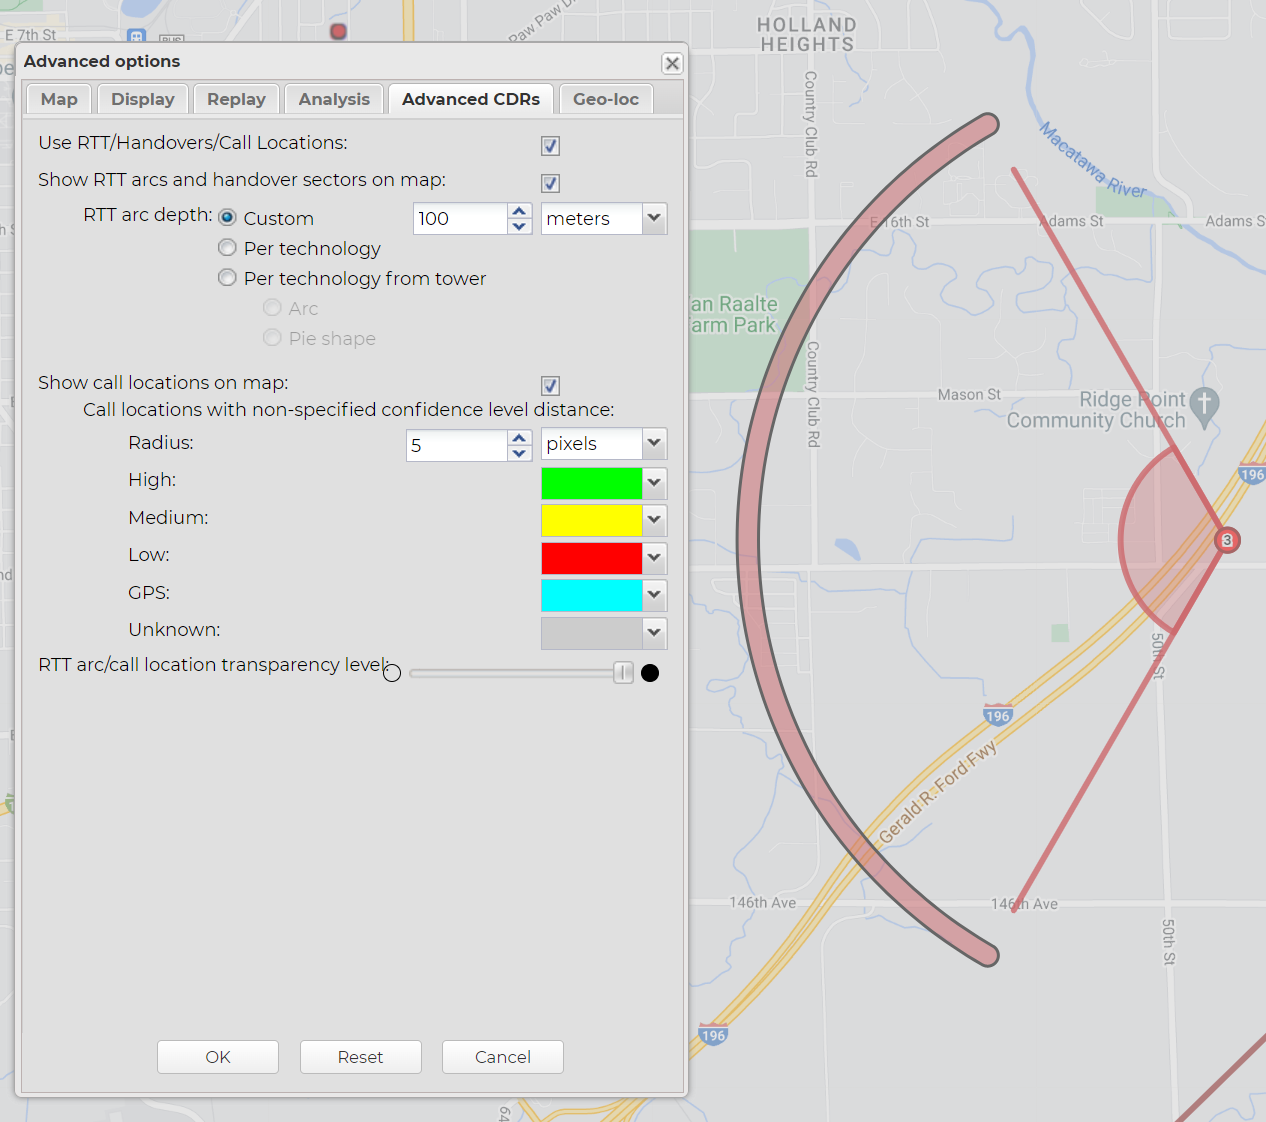
Use to set the default depth of the TA arcs when they are displayed on the map. You can either set to display:
-
Custom: using a custom default value and enter the value in meters and then select the units you want used. Typically you will not change this setting, however it may be useful to set it differently if you are trying to identify possible locations in conjunction with other TA arcs and estimated call locations.
-
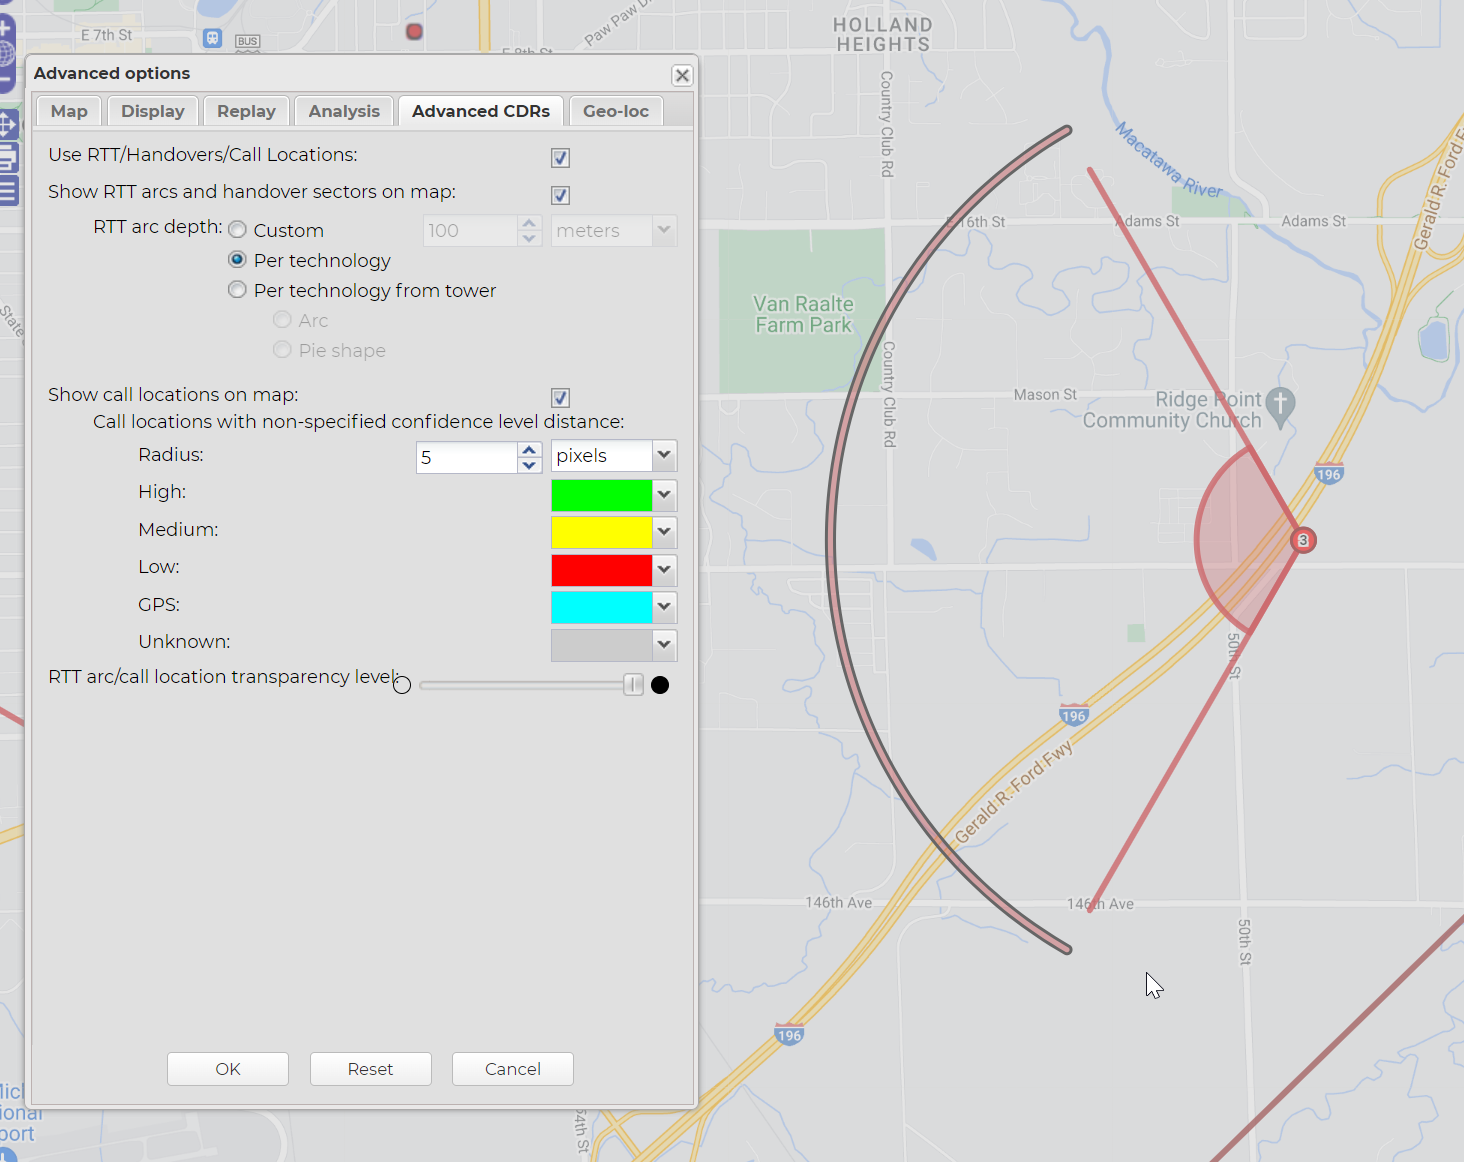
Per technology: based on the depth defined by their technology, that is:
-
LTE: 78 m. Therefore if you wanted to replicate the technology using the Custom setting you should enter this value.
-
CDMA: 244 m
-
GSM: 450 m
-
UMTS: 234 m
-
NR: uses the value set in the NR(s) setting.
The Per technology option is used by default.
-
-
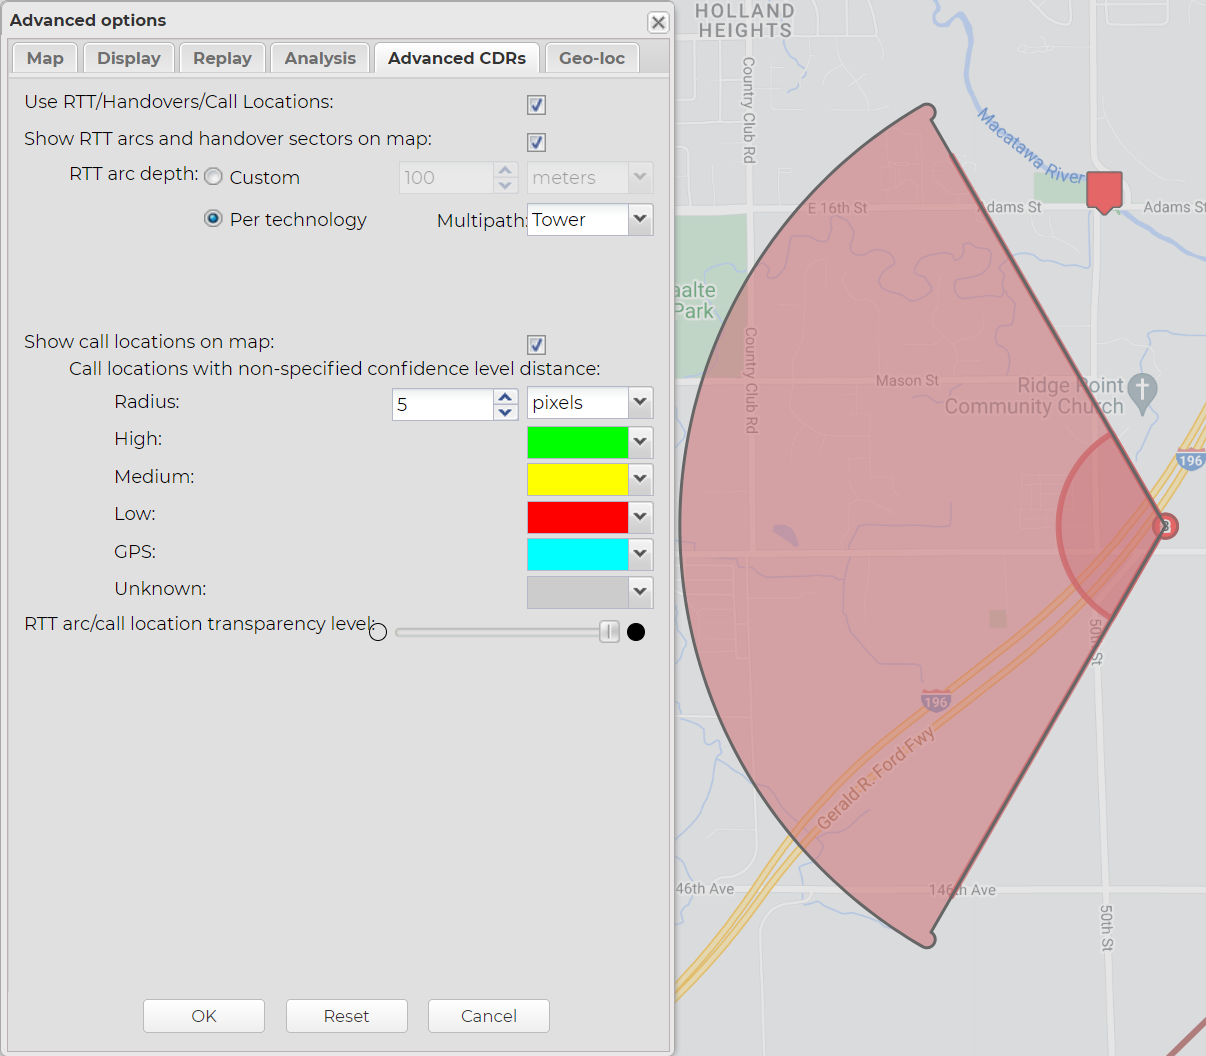
Min Multipath and Max Multipath: If you want to know the theoretical minimum and maximum distance for the timing advance use these settings as they consider multipath scenarios. The TA arc can then be displayed on the map using different methods. Which you select is dependent on your organization's preferences.
The minimum distance changes with each setting as follows:
-
0: the minimum distance = distance. This is the default.
-
-1x: the minimum distance = distance - (1 x technology depth).
-
-2x: the minimum distance = distance - (2 x technology depth).
-
Tower: displays as a pie shape with no minimum distance.
The maximum distance changes with each setting as follows:
-
1x: the maximum distance = distance + (1 x technology depth). This is the default.
-
2x: the maximum distance = distance + (2 x technology depth).
-
-
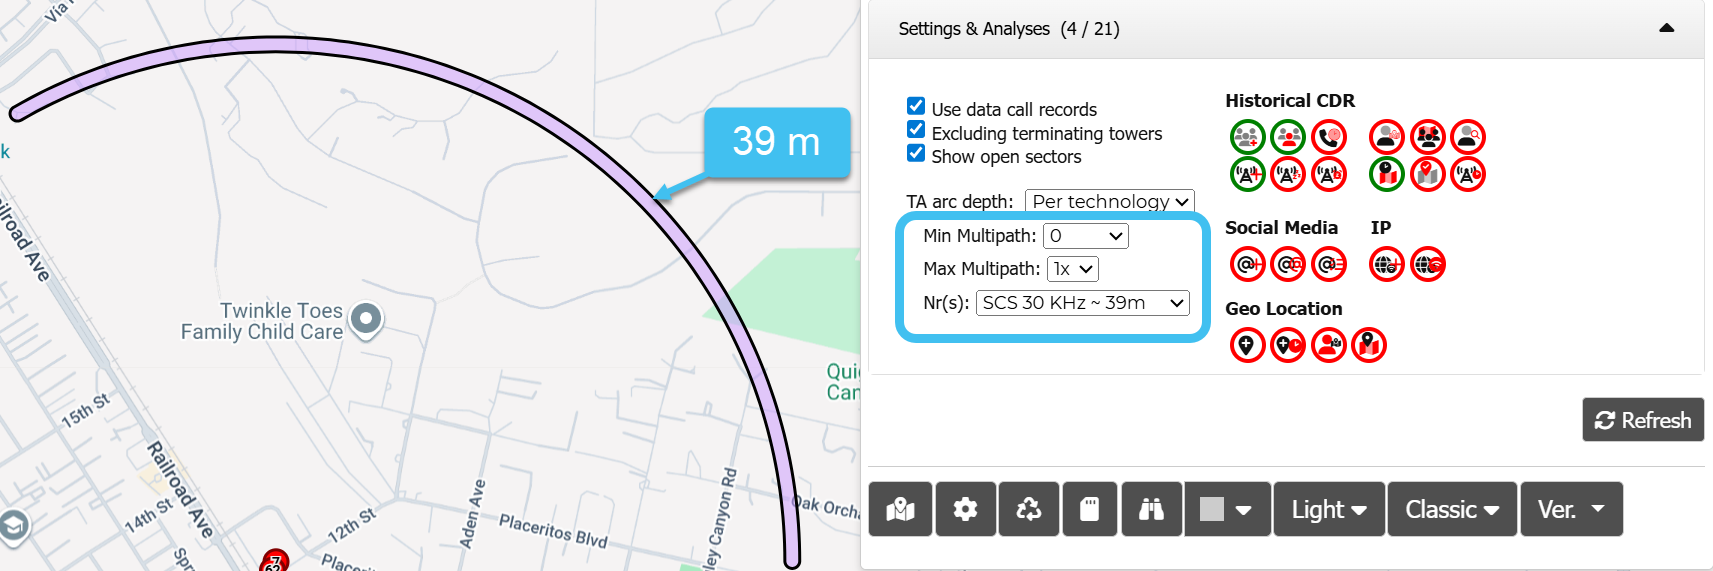
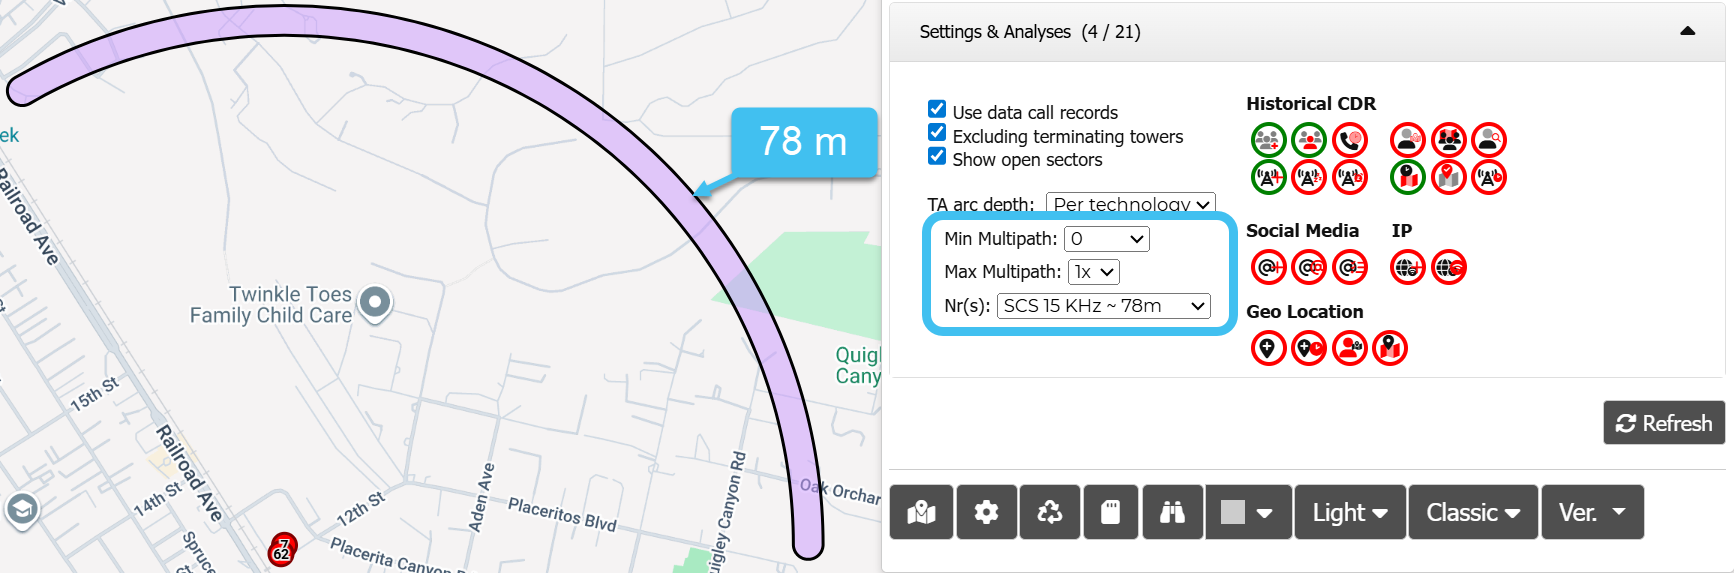
NR(s): for 5G NR (New Radio) the arc depth is based on the subcarrier spacing (SCS). The default is set to SCS 15 kHz which is 78 meters. The other arc depths are: SCS 30 kHz is 39 m, SCS 60 kHz is 19.5 m, SCS 120 kHz is 9.8 m and SCS 240 kHz is 4.8 m.
The following three graphics, which are of the NR technology, give examples of how these settings display:

Click to retrieve and display the data based on the phone numbers, license plates and time period you selected. This includes:
- All used sectors are displayed on the map and the operators for each are identified.
- All target locations are displayed on the map.
- CDR data is displayed on the Data view's CDR data tab.
- The used sectors are displayed on the Data view's Sector data tab.
- Target location data is displayed on the Data view's Target locations tab.
- Geo-location data is displayed on the Data view's Geo-loc data tab.
- If uploaded, contact data from the phone data files is displayed on the Data view's Contact data tab.
- If uploaded, time-stamped data from the phone data file, target locations and CDR file is displayed on the Data view's Timeline tab.
- If uploaded, TA data is displayed on the Data view's TA data tab.
- If uploaded, handover data is displayed on the Data view's HO data tab.
- If uploaded, public record data is displayed on the Data view's Public records tab.
The scale of the map is automatically set to include all the target locations and the used sectors.
 Map options
Click to open the Map options dialog box which allows you to set the zoom level used on the map when you click Zoom on any of the tabs on the Data view. It also allows you to set values for how the sector beam widths and radiuses are displayed on the map. You can also set the default values for how these display each time a new case is viewed.
 Advanced...
Click to open the Advanced options dialog box which allows you to set a variety of settings associated with how items are displayed on the map, the display and the call analyses common location-time results. For further information refer to Using the advanced options and Advanced options dialog box.
 Reset layout
Click to return the current configuration of the screen to the factory layout settings, that is the original layout of the views the first time you used the screen.
 Save layout
Click to save the current layout of the views. This layout is then applied to the ESPA analysis center screen when you open all your cases.
NOTE: You do not need to click this button to save any changes you have made to the views': column visibility settings, column order, column filters, sorting, and grouping; or to any color and theme changes you have made. All these settings are saved automatically.
 Views
Views
Click to define which views you want displayed on the screen.
 Colors
Select a color to apply to the borders of all the views. This is useful if you are analyzing multiple cases and you are opening views in new windows. It means you can easily identify which views are for which case based on their color.
 Theme
Theme
This allows you to customize the appearance of the ESPA analysis center screen. The theme you select is saved as your preference and is used each time you open the OSS-ESPA screen. If you select to use a different theme then the ESPA analysis center screen is automatically refreshed after you confirm the change.
 Control
Click to select the control layout you want to use:
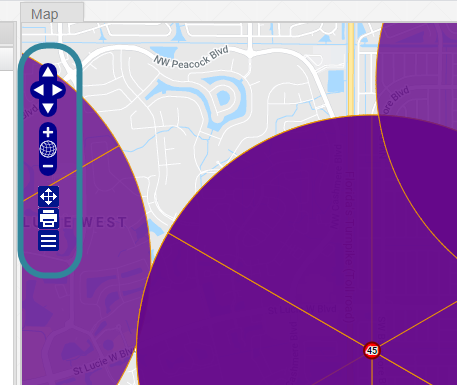
- Classic: This control layout is most similar to OSS-ESPA's original ESPA analysis center screen. It has all the same controls in approximately the same position as the original ESPA analysis center screen.
The classic control layout is highlighted in the following graphic:
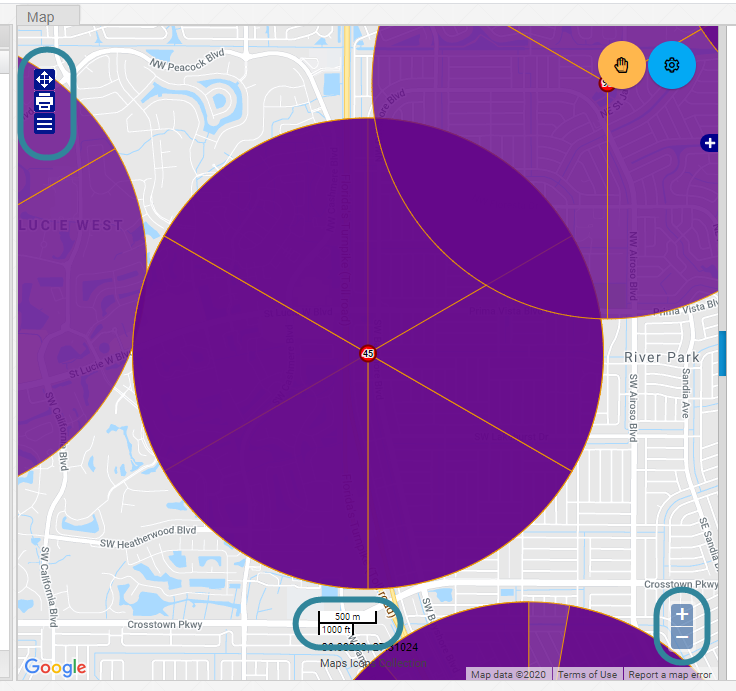
- Modern: With this control layout:
The zoom control is located at the lower right of the map. This zoom control only zooms in and out.
There is no map pan control available in this layout.
The map scale and the latitude/longitude of your mouse position is located at the bottom center of the map.
The modern control layout is highlighted in the following graphic:
-
WNF Analysis Center: Select to open the traditional analysis center.